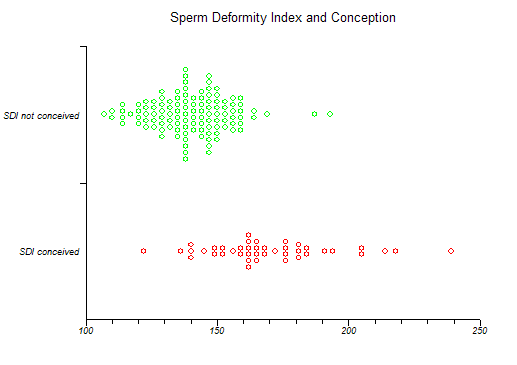
Spread Plot
Menu location: Graphics_Spread.
This is a useful way to show the spread of data across groups. It is one step back from the Box and Whisker plot in that it gives an entirely pictorial representation of the spread of your data. The vertical axis is divided into an arbitrary number of divisions which are the width of a plot point; if more than one data point occupies a division it is plotted alongside the first, thus a concentration of data at a particular value is represented by a broad band.
