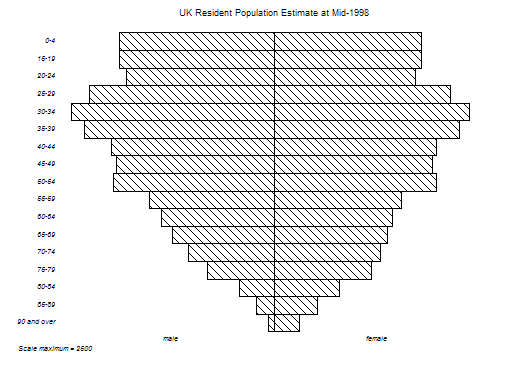
Menu location: Graphics_Population Pyramid.
This function plots a population pyramid from counts of people in age groups. For each age group you can specify either the total count or the male and female counts separately.
You should enter the counts for each age group into rows in one column of a workbook. Alternatively, if you want to specify males and females separately then enter the counts into two separate columns; one for males and the other for females. The labels for each age group should be entered into a further column.
StatsDirect lets to specify the maximum scale factor. You might want to specify a maximum scale factor if you are producing several population pyramids that you want to compare on the same scale, in this case the same scale value should be used for all plots.
Copyright © 2000-2016 StatsDirect Limited, all rights reserved. Download a free trial here.