Menu location: Graphics_Normal
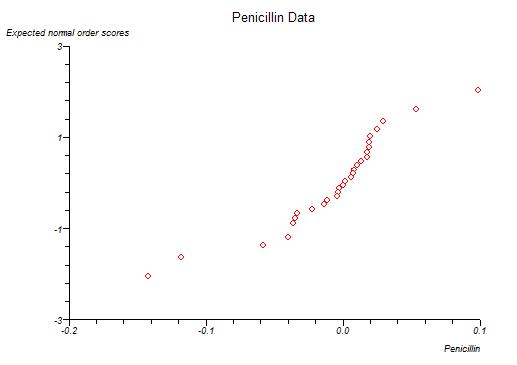
This function plots the data of a sample against their normal scores. A random sample from a normal distribution will form a near straight line plot. Normal plots are used to investigate distributions of data in this way.
Three methods are provided for the calculation of normal scores; van der Waerden; Blom; or expected normal order - see normal scores for details of the calculations.
You may wish to use the Shapiro-Wilk W test (listed under parametric methods) as a more quantitative assessment of (non-)normality.
Copyright © 2000-2016 StatsDirect Limited, all rights reserved. Download a free trial here.